Introducing the Geo Locating System: A Data-Driven Solution for Locating and Mapping Buried Utilities
Originally published in the 2020 Common Ground Alliance Technology Report
Every year, hundreds of thousands of utilities are damaged from digging up the ground, causing service interruptions, substantial costs, and threats to life and property. Having accurate, comprehensive maps of our underground infrastructure would significantly reduce the risk of utility damages, but despite our best damage prevention efforts, it remains true that we do not know where many of our utilities are.
Recent solutions have combined utility locating with mapping technology. Whether the mapping technology is supplied by a third party or is built into the locating equipment, the workflow is similar. During the locate, the operator geo-tags the utility’s estimated position using a GPS device. The positional data is captured and can be integrated with one-call software for locate and asset management. The data results in a utility map that can be maintained and shared among excavators, project planners, and asset owners.
These solutions can certainly reduce the risk of utility strikes, but there is more that can be done. The industry has yet to present an end-to-end locating and mapping solution that improves the quality of the data used to create utility maps before ground is broken.
One of the key obstacles to creating accurate utility maps is the limitation of existing locating technology, which relies on human interpretation and favorable conditions to be accurate. Poorly grounded utilities, the presence of large conductors, environmental conditions, human error, and a number of other factors can all compromise locating accuracy. In fact, the CGA’s 2018 DIRT report found that 24% of reported utility damages were due to a locating issue.
In this series of case studies, we put the Geo Locating System to the test to locate and map utilities throughout San Diego County.
- Geo Locating Transmitter: This transmitter applies multiple frequencies onto a target utility simultaneously. The set of frequencies is a range that includes what are considered low, medium, and high range frequencies for utility locating. Multiple transmitters can be hooked up to different utilities in the area to supply more information to the receiver.
- Geo Locating Receiver: This multi-sensor receiver is capable of detecting all nearby electromagnetic signals at a range of frequencies simultaneously. Onboard GPS logs the receiver’s position with respect to the detected signals. The receiver’s visual display guides the operator over the target utility. The receiver automatically plots the utility’s estimated positions at each frequency, independently of operator interpretation. The receiver captures all data in real time onto a USB for post-processing with the utility mapping platform, SubView.
- SubView™: SubView is a web-based GIS platform for creating and sharing utility maps based on the data gathered from the Geo locating receiver. SubView processes all data—including information about all detected actively applied and naturally occurring passive frequencies, as well as environmental and positional information. It then produces a complete map of utilities in the area, including each utility’s estimated horizontal position and depth. Each locate is stored in the Cloud and can be customized with notes and jobsite images, and is designed to be shared easily with key stakeholders.
In this series of case studies, we put the Geo Locating System to the test to locate and map utilities throughout San Diego County.
Case Study 1: Dense Intersection Mapping
Overview
The Geo locating receiver includes advanced motion processing, enabling it to be used to passively locate utilities while driving a vehicle. This allows for a fast way to identify multiple utilities in an area without having to disrupt traffic. Operators can mount two Geo locating receivers to a custom vehicle hitch. A survey grade GNSS instrument hitched to the center logs positional data while the vehicle is in motion.
SeeScan performed a passive scan for utilities on May 5, 2018 at the intersection of Ruffin Rd and Clairemont Mesa Blvd. Located in the Kearny Mesa community, this busy intersection lies between two major freeways and features a number of businesses, including a new hospital at the southeast corner. Immediately prior to the locate, excavators created narrow trenches using saw cuts in preparation for the installation of a 69 kV power line.
Results
Multiple passes were taken through the intersection over the course of 46 minutes. The aggregated data in SubView reveals the location of electromagnetic signals at various depths throughout the intersection. The resulting map indicates multiple utility crossings, traffic loops, and utilities that run parallel to each street. One of the utility lines appears on top of the narrow trench for the installation of the power line.
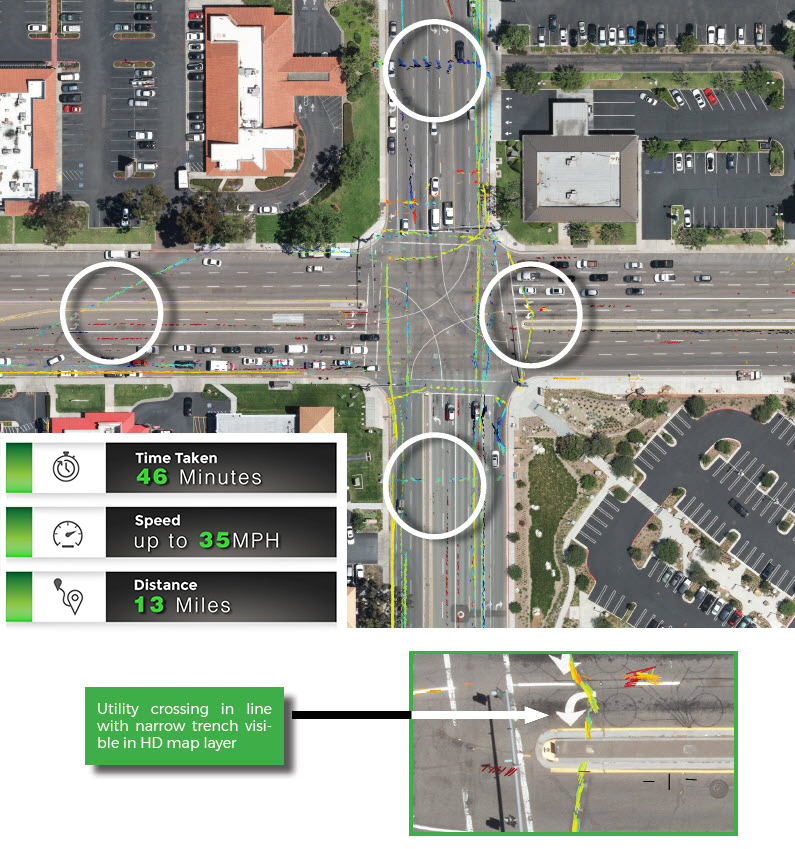
Figure 1 – The intersection shows the density of signals detected at various depths, revealing the presence of multiple utilities that cross the intersection.
Case Study 2: Isolating Utilities at DeepSea Power & Light
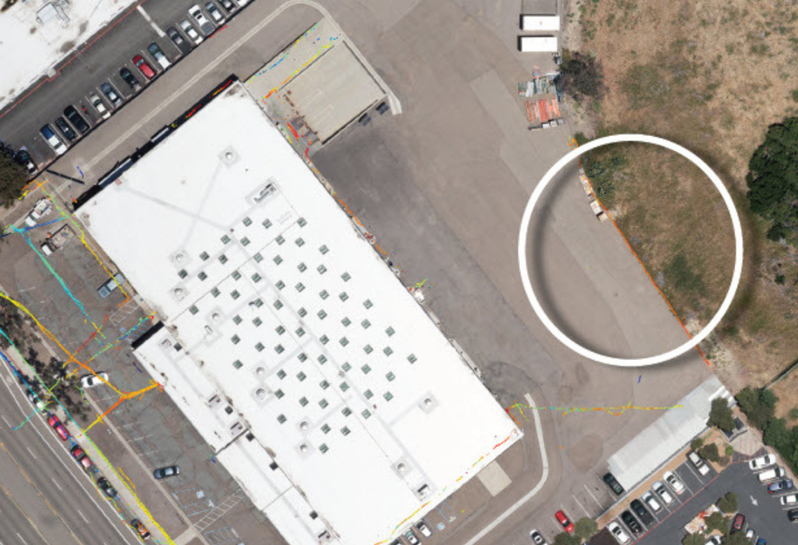
On February 19, 2018, SeeScan located utilities buried under the parking lot at DeepSea Power & Light, a business division of SeeScan. Geo locating transmitters were used to hook up to separate utilities that service the building.
Geo locating transmitters are capable of broadcasting multiple frequencies simultaneously. When using additional transmitters, different groups of frequencies can be applied to multiple utilities in the locate area. The Geo locating receiver distinguishes these groups of frequencies, enabling one operator to effectively isolate all utilities in an area. Advanced signal processing allows the combined data gathered from all of the frequencies on a utility to reveal a more accurate map of its position.
Results
Geo locating transmitters are capable of broadcasting multiple frequencies simultaneously. When using additional transmitters, different groups of testers walked through the parking lot over the course of about 45 minutes to gather all locate data. Using the SubView mobile app as well as the receiver’s optical ground tracker, photos of asset locations were appended to the map to create a fuller picture of the locate. In the back parking lot, signal bleed coupled onto a line running parallel to the canyon edge, shown after post-processing in SubView as well as on the receiver’s interface. While signal bleed is normally an obstacle, the receiver’s gradient-based antenna assembly helps to distinguish utilities that are incidentally energized.

Figure 2 – Zoomed in, the map data in SubView shows distinct utilities. Each line was energized with different groups of frequencies.
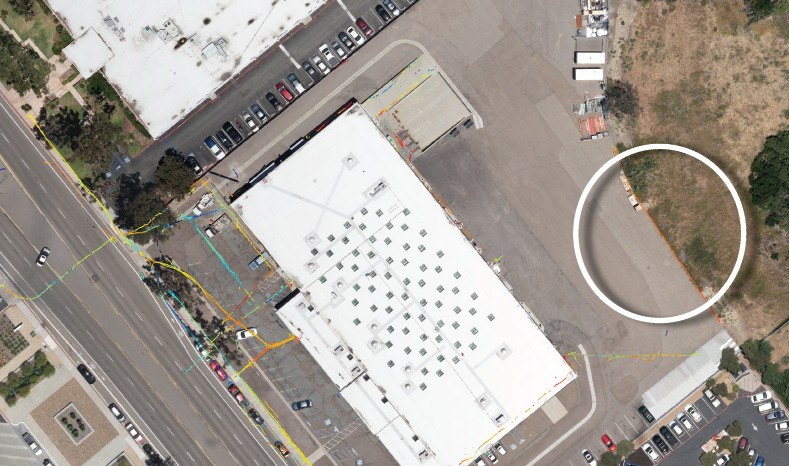
Figure 3 – The map data in SubView shows multiple distinct utilities throughout the front and back parking lots. A line running along the canyon edge reveals a separate utility energized via signal bleed.
Case Study 4: Locating 30” Gas Pipeline
Overview
How a signal appears is profoundly a function of its frequency. Applying a range of multiple frequencies to a utility at once provides a more complete picture of the target utility as well as nearby utilities in the area.2
With the Geo Locating System, the alternating current flowing on a pipeline will have both a frequency high enough to energize the pipeline and a frequency low enough to continue traveling on the pipeline. Since the receiver is able to distinguish frequencies independently and at various depths, any bleed off that energizes a nearby conductor – for example, a shallow telecommunications cable with tracer wire – adds to the complete picture of the local buried infrastructure. This has significant potential for identifying utilities that cross over pipelines.
SeeScan passively located a 30” San Diego Gas & Electric (SDG&E) gas pipeline on November 13, 2019. Natural gas pipelines are some of the nation’s most critical assets, and excavating near one poses a significant safety risk to workers and members of the public.
According to a publicly available high pressure gas pipeline map on SDG&E’s website, the pipeline travels under a parking lot off Balboa Ave near SeeScan’s campus. SeeScan testers mounted two Geo locating receivers and a survey-grade GPS to the vehicle hitch and drove through the parking lot to gather locate data on the pipeline.
Results
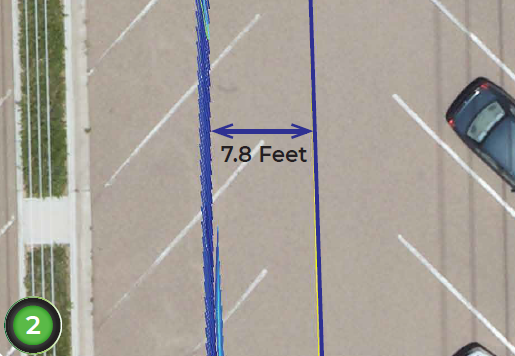
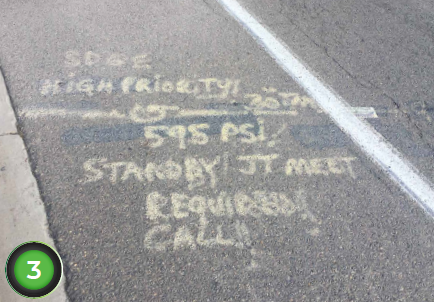
The locate map in SubView reveals the location of the SDG&E transmission pipeline at 7.8 ft. (2.4 m) west from its indicated position on the pipeline map, well outside of the utility’s tolerance zone.3 The depth is approximately 7 ft. (2.1 m); no depth information is available on the pipeline map. The utility’s estimated position in SubView lines up with paint markings in the street from a locate performed by SDG&E.
Data gathered from the receiver shows an additional buried utility that crosses over the pipeline. The observed utility terminates at an electrical box, indicating an electrical line.
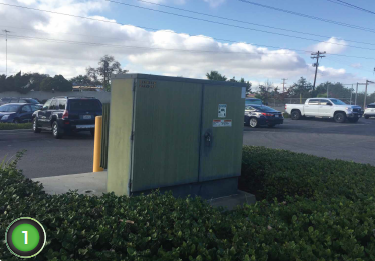
Data gathered from the receiver shows an additional buried utility that crosses over the pipeline. The observed utility terminates at an electrical box, indicating an electrical line.
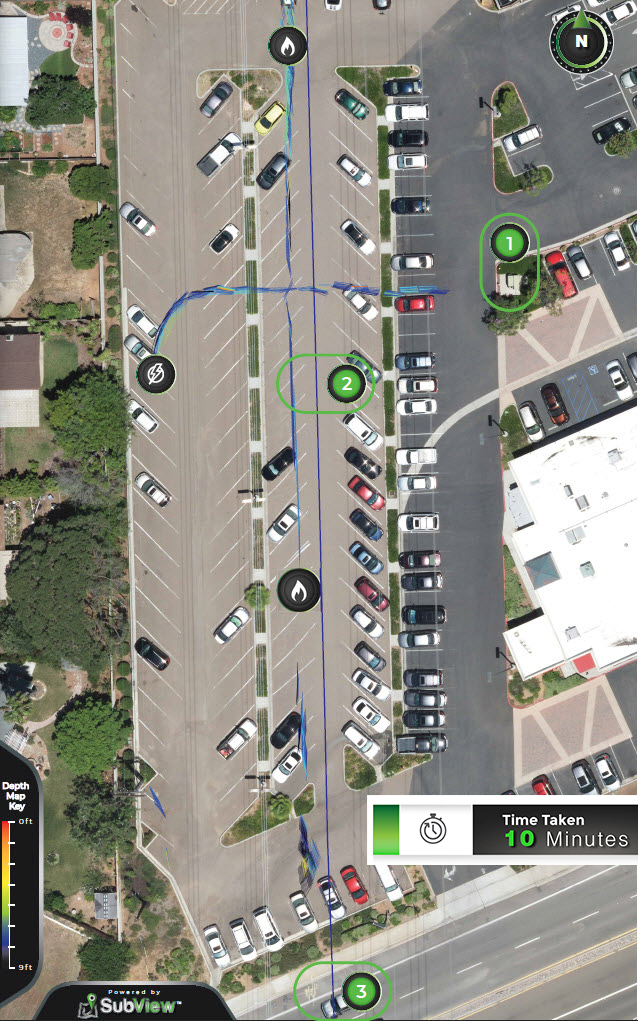
Figure 4 – The map in SubView reveals a shallow electrical line that crosses over the pipeline (1). The transmission pipeline lies approximately 7.8 ft. to the west of the position in the SDG&E map (2). The pipeline’s location lines up with paint markings in the street from a recent locate (3).
Conclusion
With a congested utility network and new utilities being buried every year, it is crucial that we improve our visibility into the underground. There are many challenges to making that visibility possible, but technological advancements and a shared commitment to safety can help. The Geo locating system is a fully integrated mapping solution, and in the near future will offer key stakeholders with easily shareable, data-driven utility maps to protect our nation’s vital underground assets.
References
1 Locating issues include a number of causes such as facility marked inaccurately due to locator error, facility marked inaccurately due to abandoned facility, site marked but incomplete, and facility not marked due to abandoned facility.
2 The American Society for Civil Engineers (ASCE) confirms the need for using multiple frequencies when locating utilities, stating: “A wide range of available frequencies is necessary to search for utilities. In general, frequencies from 50 Hz to 480 kHz can be successful. It is usually prudent to have this complete range available during a utility locate. For example, a relatively shallow cast iron pipe with rubber or other nonmetallic jointing material might only be found using the high 480-kHz frequency, whereas a deep steel pipeline may need the 8-kHz frequency to find it and the 1-kHz frequency to trace it for any length of distance.”[Emphasis added] From the Standard Guideline for the Collection and Depiction of Existing Subsurface Utility Data.” American Society of Civil Engineers Reston, VA: 2003. Pg. 15.
3 Pipeline map information gathered from https://www.sdge.com/safety/gas-safety/pipeline-map. According to the website, the accuracy of pipeline locations varies +/- 500 feet.


